
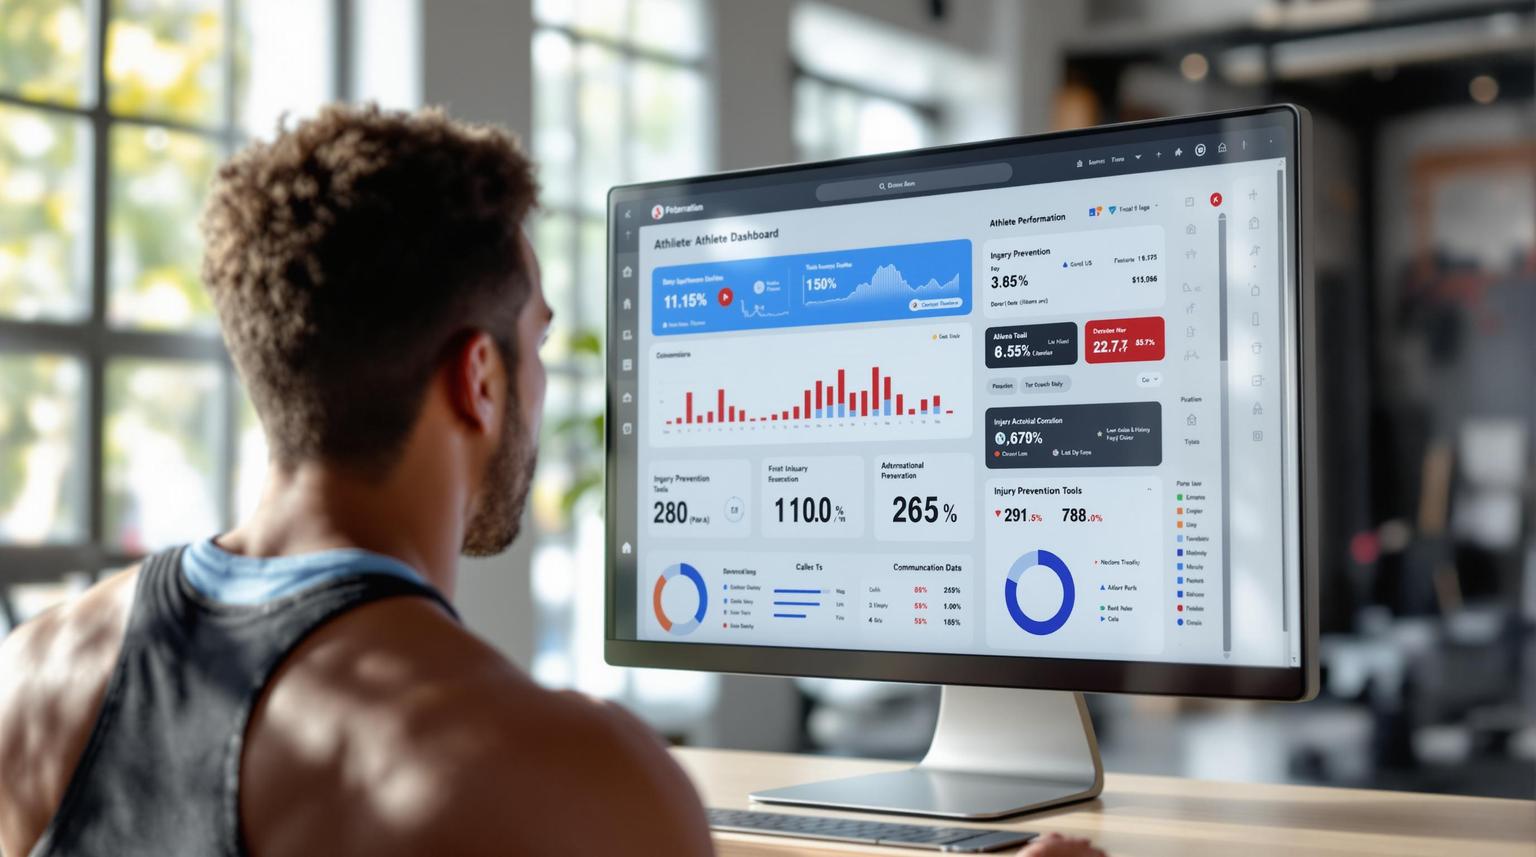
Athlete performance dashboards simplify training data into actionable insights for coaches and athletes. Here’s what you need to know:
- Why Use Dashboards?
- Track real-time metrics for quick decisions.
- Integrate data from wearables, competition results, and training logs.
- Prevent injuries by spotting risks early.
- Improve communication between athletes and coaches.
- How to Build Effective Dashboards:
- Focus on relevant metrics like VO2 max, shot accuracy, and decision-making speed.
- Use clear visuals (line charts, heat maps) to make data easy to understand.
- Ensure mobile access for on-the-go usability.
- Customize views for coaches, athletes, and staff.
- Key Features:
- Real-time data synchronization.
- Role-based access for security.
- Integration with wearables and APIs for seamless data flow.
Dashboards turn complex data into decisions that improve performance, prevent injuries, and help teams succeed. Ready to create one? Let’s dive into the details.
Data Visualization in Sports Science
Best Practices for Data Selection and Organization
When building athlete performance dashboards, picking the right data and organizing it effectively is essential. The goal? Focus on metrics that offer actionable insights while keeping everything clear and accurate.
Choosing Relevant KPIs
An effective dashboard starts with identifying key performance indicators (KPIs) that matter. These should align with both the athlete’s individual goals and the team’s broader objectives. Here’s a breakdown of important KPIs based on performance areas:
| Performance Category | Key Metrics | Why It Matters |
|---|---|---|
| Physical | VO2 max, Sprint speed, Recovery rate | Tracks fitness levels and conditioning |
| Technical | Pass completion %, Shot accuracy, Tackle success | Evaluates skill execution |
| Tactical | Position heat maps, Formation adherence | Assesses strategic performance |
| Mental | Decision-making speed, Focus metrics | Monitors psychological readiness |
"The key to effective performance dashboards is not just collecting data, but presenting it in a way that enables quick, actionable insights." – Dr. Bill Gerrard, Professor of Sport Management & Finance, University of Leeds
Structuring Data for Clarity
To ensure your data is easy to navigate, organize it in a way that makes sense:
- Group similar metrics together for a logical flow.
- Use consistent naming conventions to avoid confusion.
- Build hierarchies that reflect how data is used.
- Create role-specific views tailored to coaches, analysts, or athletes.
Ensuring Data Accuracy and Timeliness
Accurate and up-to-date data is non-negotiable. Implement automated systems to keep everything in check:
- Real-time verification to catch errors immediately.
- Outlier detection to flag unusual data points.
- Cross-referencing between multiple sources for consistency.
Additionally, follow strict quality control measures:
- Regularly calibrate measurement tools.
- Use standardized data entry processes.
- Sync data automatically across all platforms.
These steps ensure the data you work with is reliable, laying the groundwork for effective visualizations – something we’ll cover in the next section.
Designing Effective Visuals and Layouts
Building dashboards that are both intuitive and visually appealing requires a focus on structure and user experience. Smart design choices can make it easier for athletes and coaches to quickly understand performance data.
Focus on Simplicity and Clarity
Keep the design clean and straightforward by emphasizing visual hierarchy. You can achieve this by:
- Using plenty of white space to lighten the mental effort required to process information.
- Sticking to a limited color palette (no more than 5-7 colors).
- Establishing a clear typography hierarchy with just 2-3 fonts.
- Arranging elements in a grid layout to group related information logically.
These principles create a solid foundation for selecting visuals that make data easier to grasp.
Selecting the Right Visualizations
Choose visualization types that align with the key performance indicators (KPIs) you’ve identified. Here’s how to match metrics to visuals:
- Line charts: Best for showing trends over time.
- Heat maps: Useful for highlighting spatial patterns.
- Bar charts: Ideal for comparing different categories.
- Radar charts: Great for analyzing multiple attributes at once.
- Scatter plots: Perfect for exploring relationships between metrics.
Making Dashboards Mobile-Friendly
Since coaches often need access to dashboards on the go, ensuring they work seamlessly on mobile devices is crucial.
Key mobile-friendly features include:
- Touch targets that are at least 44px for easy tapping.
- Placing important information within thumb reach.
- Simplified navigation to avoid unnecessary clicks.
- Quick-loading data displays to save time in the field.
Customization and Actionable Insights
Effective dashboards provide tailored insights that help users make informed decisions and improve performance. Here’s how:
Enabling User Customization
Dashboards that offer role-specific customization let coaches and athletes zero in on what matters most to them. For example, the Golden State Warriors use a dashboard that highlights player-specific metrics for athletes and team-wide trends for coaches.
To make dashboards more user-friendly, consider features like:
- Drag-and-drop widgets for easy layout adjustments
- Sport-specific metrics to focus on relevant data
- Adjustable time frames for flexible analysis
- Role-based views tailored for athletes, coaches, or physiotherapists
- Custom alerts to notify users of key updates
Identifying Trends and Offering Recommendations
By analyzing historical data, dashboards can uncover patterns and provide actionable suggestions. This goes beyond just showing numbers – it’s about delivering insights that users can act on immediately.
"The ability to customize performance dashboards has revolutionized how we approach athlete development. It’s not just about data collection anymore; it’s about presenting that data in a way that’s immediately actionable for each individual athlete and coach." – Dr. Michael Johnson, Sports Science Director, US Olympic Committee
Key tools to include:
- Algorithms for pattern recognition
- Anomaly detection to flag unusual data
- Comparative analysis to evaluate performance
- AI-driven recommendations for training
- Contextual insights from multiple data sources
Setting Benchmarks and Goals
Dashboards also play a role in setting clear benchmarks and tracking progress. Platforms like Output Sports allow coaches to customize performance targets and monitor improvements over time.
For effective goal-setting:
- Define personalized targets based on individual abilities
- Use visual progress indicators to track improvements
- Compare results with team and league averages
- Dynamically adjust goals as progress is made
Integrating Data Sources and Ensuring Accessibility
Integration with Wearables and Tools
Dashboards need to connect seamlessly with various data sources to function effectively. Advanced systems can process over 20,000 data points per second from wearables.
Key integration features include:
- Real-time synchronization to ensure data is always up-to-date across devices.
- Standardized formats for consistent and accurate analysis.
- Battery efficiency to keep connected devices running longer.
- Scalable designs that can handle new data sources as they’re added.
These features align with mobile-first approaches, ensuring users can access complete data on any device.
Implementing Access Control
Protecting athlete data is critical. A robust access control system safeguards sensitive information while allowing authorized stakeholders to access the data they need.
"The ability to maintain strict control over sensitive athlete data while still providing seamless access to authorized personnel is crucial for modern sports organizations. It’s not just about security – it’s about creating an environment of trust." – Dr. John Smith, Head of Sports Science at Stanford University
Here’s a breakdown of essential access control features:
| Feature | Purpose | Method |
|---|---|---|
| Role-Based Access | Limit data visibility | Assign specific permissions for athletes, coaches, and staff. |
| Multi-Factor Authentication | Strengthen security | Add extra verification steps beyond passwords. |
| Single Sign-On | Simplify user access | Provide one login for multiple systems. |
| Audit Logging | Ensure accountability | Record all data access and modifications. |
Providing API Access
Dashboards that offer API connectivity open the door to broader integrations, with adoption in sports analytics platforms increasing by 45%. Many top organizations use APIs to merge wearable data with on-court tracking systems.
APIs should support:
- Custom tool creation.
- Integration with existing systems.
- Automated data gathering.
- Compatibility with third-party tools.
When designing APIs, focus on:
- Clear documentation to help developers.
- Rate limiting to avoid overloading systems.
- Version control to maintain compatibility.
- Strong security measures to protect data.
- Performance monitoring to identify and fix issues quickly.
Leveraging Expertise in Dashboard Development
Role of 2V Modules in Sports Tech

When it comes to creating modern dashboards for sports, having a deep understanding of both technology and athletic performance is crucial. This is where 2V Modules comes in. They specialize in developing dashboards designed specifically for the sports industry, blending technical know-how with insights into athletic performance to deliver customized solutions.
Their dashboards are built with specific roles in mind, emphasizing key areas of development:
| Focus Area | Key Benefit |
|---|---|
| Multi-source Integration | Provides a unified view of performance data |
| Role-Based UI | Simplifies data access for specific users |
| Military-Grade Security | Ensures athlete data is fully protected |
| Modular Architecture | Prepares systems for future needs |
Why Choose 2V Modules?
Partnering with experts like 2V Modules comes with a range of benefits tailored to the unique demands of sports organizations:
- Sports-Centered Solutions: Dashboards designed to meet the specific needs of athletic performance tracking.
- Seamless Integration: Effortless connection with existing tools, systems, and wearable devices.
- Top-Tier Data Security: Ensures that sensitive athlete information stays protected.
- Scalable Systems: Designed to grow and adapt as organizational needs change.
Additionally, 2V Modules offers ongoing support, including system performance optimization, regular security updates, and user assistance. Their emphasis on user-friendly interfaces ensures that even the most complex data is easy to understand and use for coaches, athletes, and other stakeholders.
Conclusion and Key Takeaways
Best Practices for Athlete Performance Dashboards
Building effective athlete performance dashboards requires a clear focus on delivering insights that drive decisions. Research shows that teams using advanced analytics through well-constructed dashboards are 2-3 times more likely to excel in their leagues.
Here are some proven strategies:
| Practice | Approach | Benefit |
|---|---|---|
| Data Selection | Prioritize sport-specific metrics | Focuses on relevant performance areas |
| Visualization | Use simple, clear designs | Makes data easier to understand and apply |
| Integration | Combine data from multiple sources | Offers a full picture of performance |
| Security | Apply role-based access controls | Safeguards sensitive athlete information |
Why Dashboards Matter for Sports Teams
Performance dashboards have consistently delivered measurable improvements for sports organizations. They are no longer just tools for tracking stats – they are used to transform complex data into decisions that impact game outcomes.
"Well-designed athlete performance dashboards are not just about data visualization; they’re about translating complex information into actionable insights that can make the difference between winning and losing." – Dr. Simon Brundish, Sports Science Consultant, Liverpool FC
This growing reliance highlights how dashboards have become essential in modern sports management. By following these strategies, teams can turn raw data into decisions that give them a competitive edge.